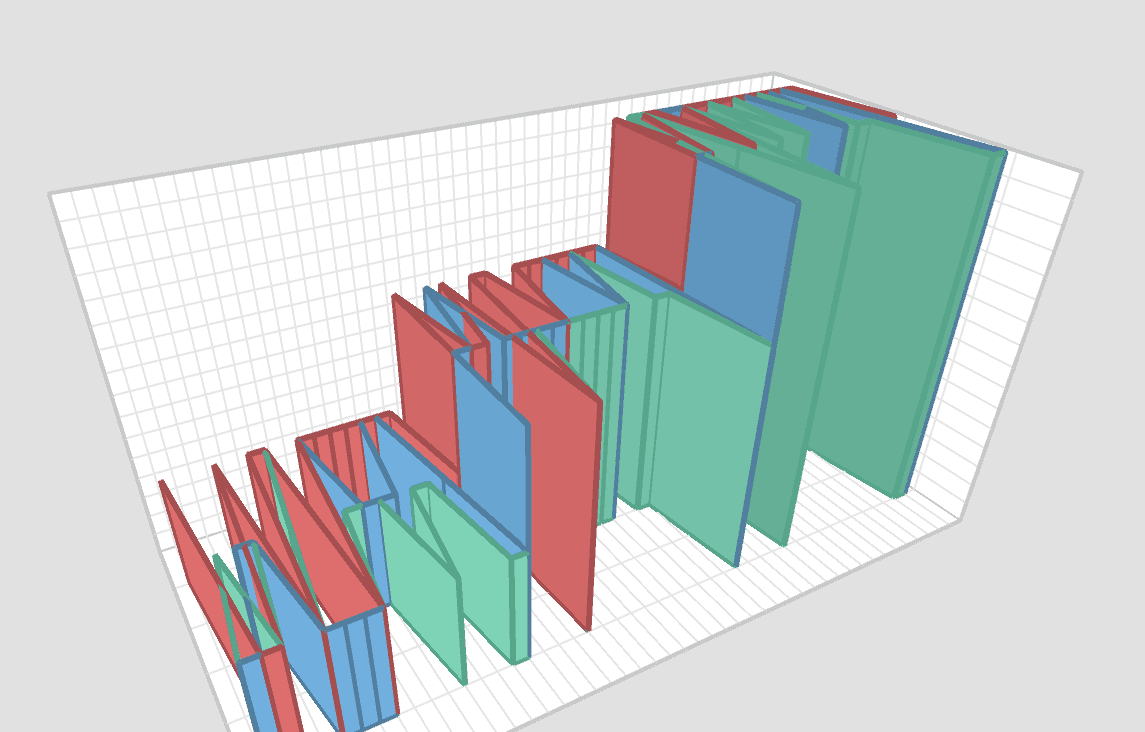
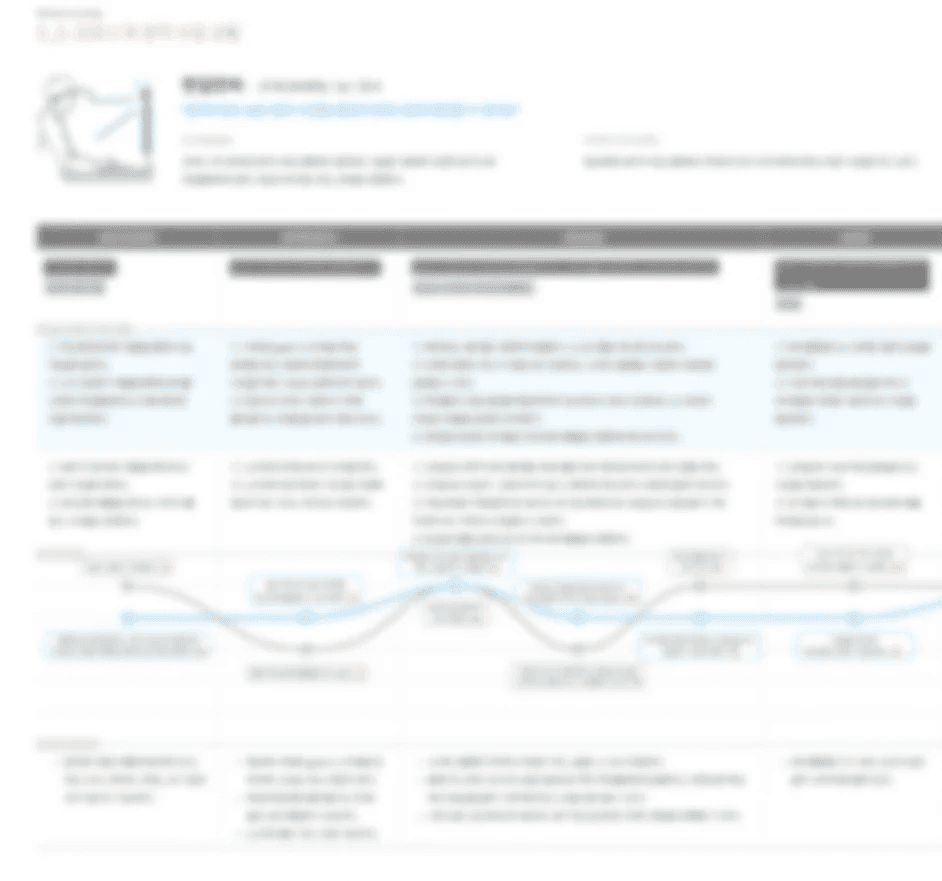
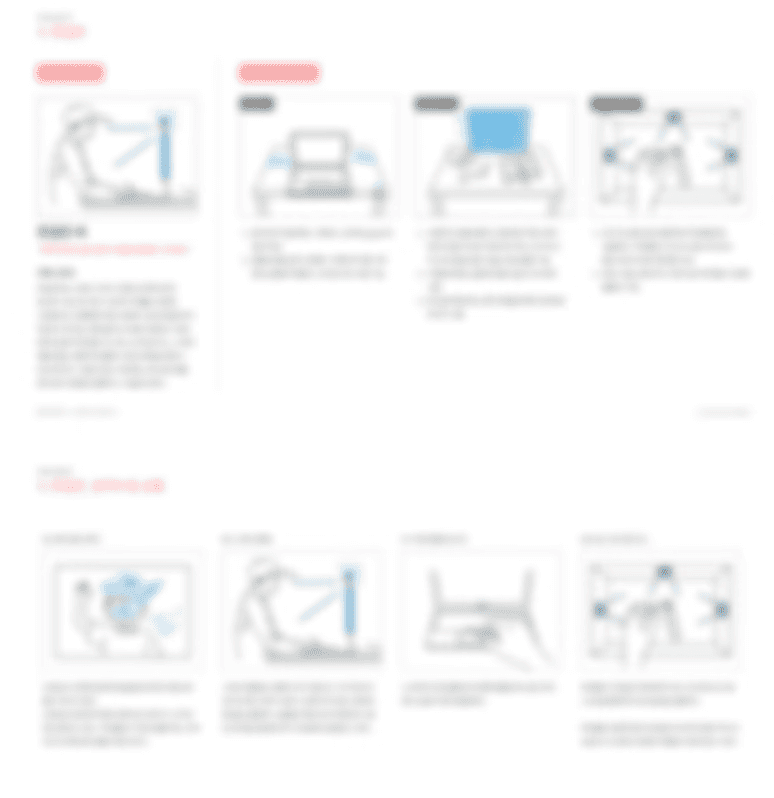
This project proposed a novel approach to visualizing customer journey maps in 3D, enabling a more interactive and comprehensive understanding of consumer behaviors. I developed a program that allows users to upload Excel files, automatically generating 3D journey maps for deeper insights into customer interactions and touchpoints.
By transforming traditional 2D data into dynamic 3D visualizations, the tool facilitates better analysis of complex relationships within customer journeys. This innovative approach not only enhances data interpretation but also identifies actionable opportunities for customer-centric design research.
This project was conducted as an industry-academia collaboration with LG Electronics
Defining the Objective
The goal was to create a 3D visualization tool that transforms traditional 2D customer journey data into an interactive 3D map, providing deeper insights into customer interactions and behaviors.Input Data Structure
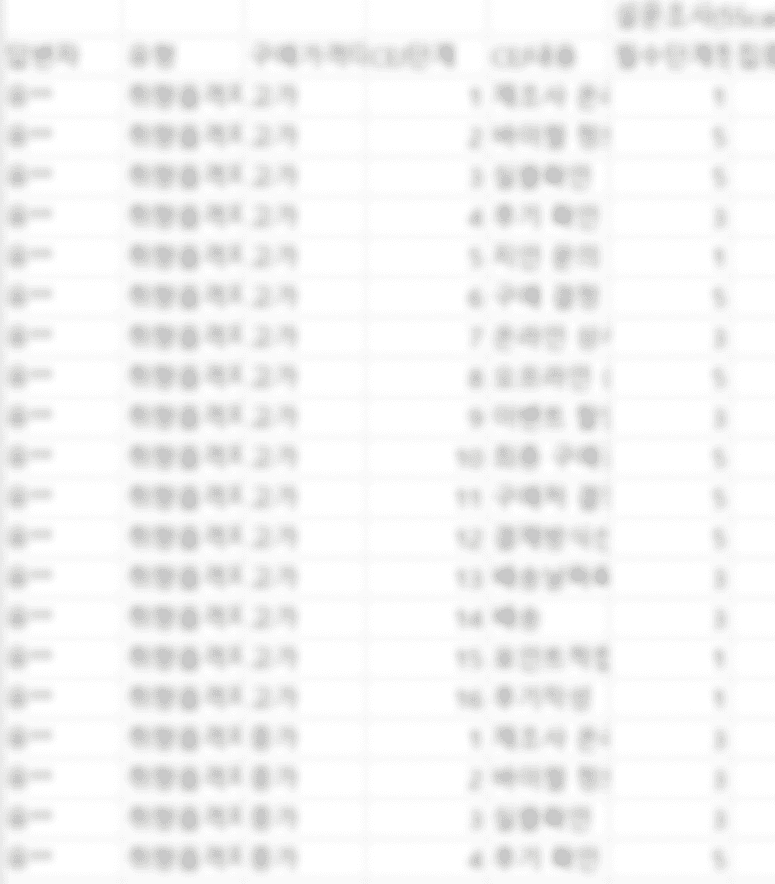
The program was designed to accept Excel files as input. These files contained structured data such as:
Stages: Sequential phases in the customer journey.
Touchpoints: Key interactions within each stage.
Attributes: Data such as time spent, user satisfaction, and priority levels for each touchpoint.
Data Parsing
The Excel file was parsed into a format that Processing could interpret. CSV conversion was used for compatibility.
The parsed data was organized into arrays and objects, representing stages, touchpoints, and their respective attributes.
3D Visualization Setup
Coordinate System: A 3D coordinate system was established in Processing using its built-in P3D renderer.
Mapping Data to Coordinates: Each stage and touchpoint was assigned a position in 3D space. Stages were arranged along the X-axis, and touchpoints were distributed along the Y and Z axes based on their attributes.
Connections: Lines and curves were used to connect related touchpoints, visualizing relationships and transitions between interactions.
Mar. 2021 - Jul. 2021


